


Flip or Flop: Who Maintains Dynasty Value?
Trying to find which NFL prospects fantasy managers can still flip a year out

There’s an old adage about driving cars off lots I’m sure you’ve heard, but it sounds better coming from legendary TV wiseass Bertram Gilfoyle. The minute you convert a liquid asset like cash into something like a car, it immediately starts depreciating in value. There’s a reason that collectors don’t bandy about their Mickey Mantle rookie cards in public, for example, or actually play games with their copies of Black Lotus.
Fantasy Football—and real life sports, for that matter—presents a similar conundrum. NFL podcasters talk a lot about a general manager “clock”, that once you take a QB with a high draft pick, you’ve now imposed expectations on yourself that didn’t exist before. A similar conundrum exists for fantasy GM’s, who, by converting picks into actual players, are now tied to them, for better or worse.
Every fantasy sports manager faces this challenge, including even the most NBA-pilled Sam Hinkie wannabe who’s loath to actually make their picks, preferring to punt them away into future years. At some point, even that guy has to choose who he wants on his roster, like it or not.
Many prospects are losing bets

The problem is that fantasy football assets are a lot like cars, except worse: whereas most rookies hang around for at least three years on pro rosters, many fantasy prospects lose a significant portion of their value over the first year alone.
This isn’t universally true, as the graph above shows. The median Tight End and QB prospect increases in KeepTradeCut value over their first year, while the median back or receiver often sinks. Unless noted otherwise, values in this article are from single-QB, no TE premium leagues, comprising the 2023 and 2024 rookie classes.
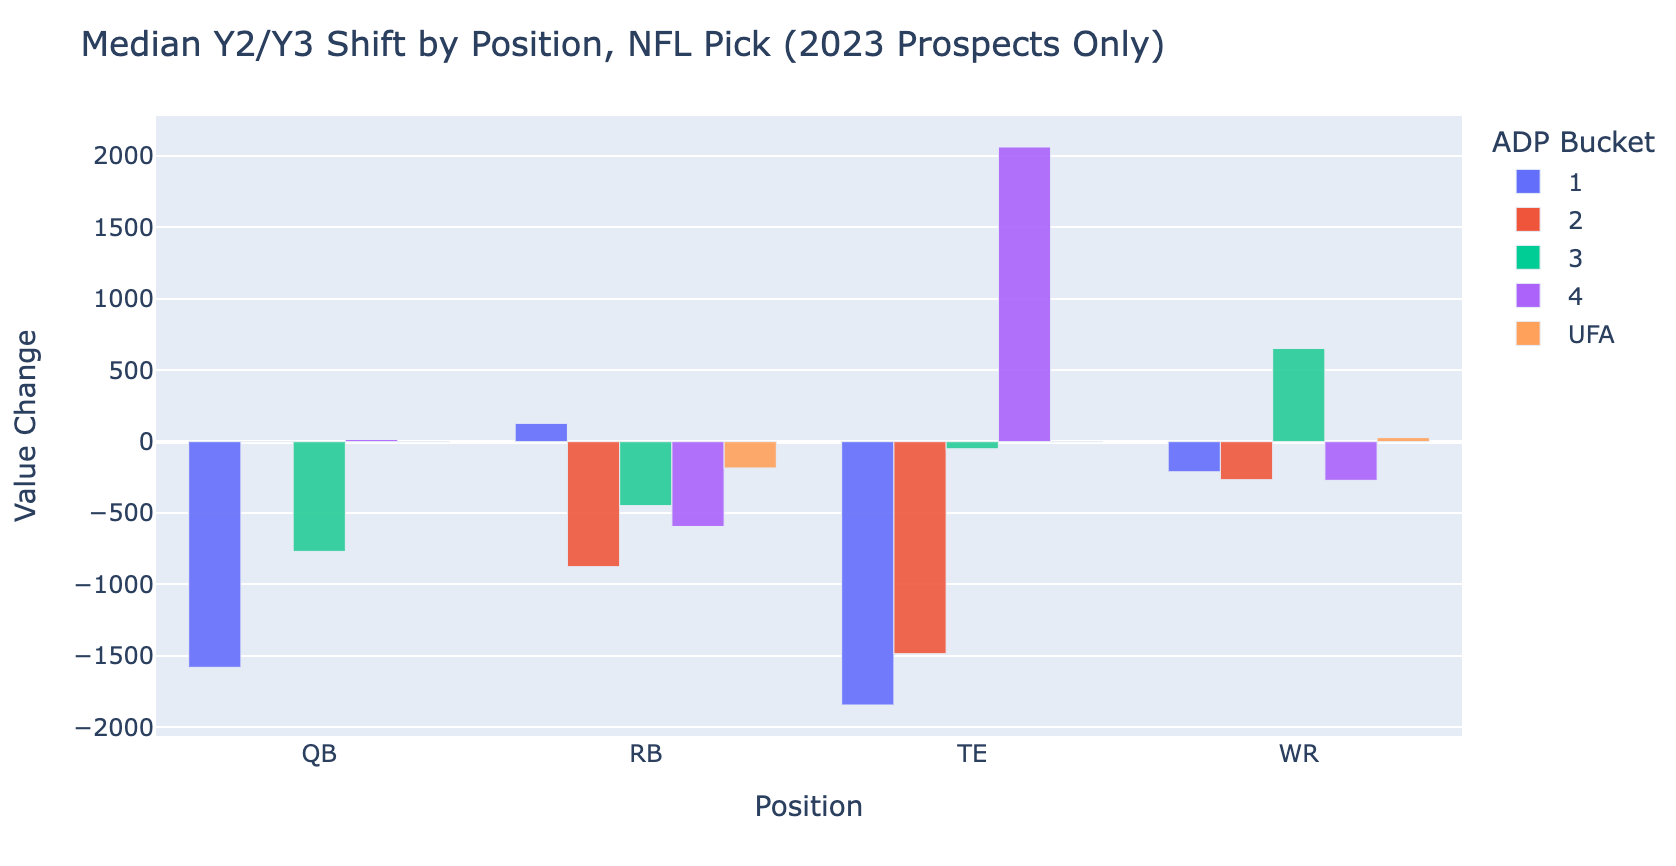
Zooming out to year three of a player's career, however, things become a bit bleaker. Granted, the chart above is only for 2023 rookies, and the data here largely reflects quirks of that draft class. The TE dip is guys like Dalton Kincaid crashing down to earth, while the risers are Tucker Kraft and Brenton Strange, perhaps confirming the notion that TE’s take a while to develop. The RB falloff also speaks to the weakness of the ‘23 RB class outside of Bijan and Gibbs. It was full of guys with a chance to overtake an aging or questionable starter, yet many never did so.
Asset Stability

In the first bar graph from this post, we saw that many QB’s and TE’s gained value heading into the following year’s draft. Notably, the box-and-whisker plot above also shows how few TE’s decreased in value going into Year 2. The biggest decrease is less than 1,000 points of KeepTradeCut value, suggesting that, at least over the first year of a player’s career, tight ends have a high floor.
Quarterbacks are similarly stable, at most losing 1,500 points of value by Year 2. QB’s also accrue more value: the median QB gains 500 points of value, while the 75th percentile QB adds 1,600 points. Many factors cause this: QB’s tend to improve in Year 2, are given more leeway than other prospects, and the ‘23 and ‘24 classes were strong. In any case, we can decisively claim that good QB prospects are safer assets.
Comparatively speaking, Running Backs and Wide Receivers have lower floors (about a -2000 point decline). Receivers are slightly less volatile, with a smaller range of outcomes, a better 75th percentile outlook, and a median change of zero. The median RB, by comparison, is the only position to decline in value year-over-year. Overall, RB’s and WR’s are both volatile assets, while receivers have more consistent upside.
Adjusted Liquidity Index (ALI)
All this is useful, but we’re still ignoring why people invest in RB’s and receivers. After all, nobody wants an asset that has a low floor and hard-to-realize upside.
This is where liquidity matters, giving us our Adjusted Liquidity Index (ALI). ALI utilizes additional recent-trade data from the KeepTradeCut trade database. We want to see how frequently year-two players are traded, relative to their value.
You don’t just want to draft guys who are nominally valuable, but guys you can actually move, which matches the book definition of liquidity. This may sell top prospects short, but there are real-life parallels here. You’ll get many offers for Brock Bowers, for example, if you put him on the block, but it’s harder to get satisfactory ones, much like getting book value for a multi-million dollar mansion is easier said than done.
Positional Liquidity

What ALI does successfully capture is positional liquidity. If you compare the top 20 players by ALI and overall value above, you’ll see that RB’s are disproportionately represented in terms of top ALI, while QB’s suffer. Simply put, people are more willing—and able—to trade away second-year RB’s.
The 2024 class did, however, put many valuable QB’s on the map. These guys are, relative to their value, being traded less than you’d expect, though managers wanting to keep Jayden Daniels is understandable. Caleb Williams is also being traded less often than Drake Maye is in recent weeks; it could be that Caleb’s a sunk cost for some owners, while Maye drafters are happy to flip him for a huge profit.
Liquidity Index’s hottest commodities

Even considering the most liquid QB’s, however—like Bo Nix and Michael Penix—they’re still traded less frequently than WR’s or RB’s of equivalent value, barely cracking the top 25 in ALI. The metric is normalized to be out of 100, with our benchmark player being Dolphins RB Jaylen Wright; Tyrone Tracy is only at 148 because he literally broke the scale, so he gets to live in his own weird outlier space, instead of screwing up everybody else’s ALI by keeping him in.
As far as Wright goes, he’s being traded far more often than you’d expect for a mid-value RB that performed poorly as a rookie to be. Then again, this metric is tracking which players managers actually want to flip after their first year in the league. The value in our ALI is finding out what kind of players will be liquid assets a year from now, regardless of what direction their career’s headed.
The answer to that, quite resoundingly, seems to be receivers and running backs, who dominate our top 10 above. This tracks, given they’re the lifeblood of fantasy football: people generally need more of each than they do other positions. It’d explain the lower trade velocity of QB’s, too, since QB’s are mostly being swapped for each other. Either way, if there’s one lesson to take away from my analysis, it’s this: mid-tier WR’s and RB’s are easier to move than most TE’s and QB’s.
Liquidity Index’s best late-round values

This piece actually began as an exploration of which late-round/UFA dynasty prospects are the best future investments. Though we’ve veered far from that course, what we’ve discovered still maps pretty well to that original problem statement.
My initial hypothesis going into this post was that Tight Ends would be stronger later-round/UFA selections, if only because you’re picking players with real pedigree, who tend to stick on rosters. Though RB’s still lead the pack (there’s that pesky Tracy again), there’s meaningful TE representation here, with many being traded a decent amount, while also boasting above-replacement KeepTradeCut values.
In this, we have the closest thing to a grand thesis for our article. Per the prior chart, you ought to spend mid-round picks on RB’s and WR’s if you want to be able to flip them the following year, regardless of how their value changes. Conversely, you should spend late-round picks/FAAB on RB’s and Tight Ends.

Summary
This post is already running long, so let’s get down to brass tacks:
Rookie QB’s and Tight Ends are stable, high-floor investments
RB and Receiver Prospects are more likely to lose value a year out
Mid-round RB’s & WR’s are highly liquid assets, even if they lose value
RB’s & TE’s = most consistently liquid late-round bets
All this confirms some core fantasy truisms, yet with some interesting wrinkles. You should take a bunch of mid-round dart throws on receiver and running back, for example, not because they have high hit rates, but because teams need multiple starters at each position. This makes them a meaningfully more liquid asset than other positions, which matters a lot. All the nominal value your rookie QB accrued over a year is worth little if nobody’s willing to meet the asking price, for example.
The bar is slightly lower for late-round dynasty picks and UFA’s, where if you can scrounge any value from them, it’s a win. Tight ends are great bets here, since they are, in so many words, real prospects. While draft capital is only mildly helpful for choosing late-round dynasty picks—many successful RB’s defy their NFL Draft pick, for example—there seems to be a real signal when it comes to tight ends. Though we only have trade data for ‘24 prospects, late-round dynasty TE’s would look even better if we included the very deep ‘23 class, which saw huge upticks in value for Brenton Strange and Tucker Kraft—both top-80 picks—the following year.
Hopefully this gives you the tools to squeeze that tasty extra value out of your dynasty football draft this year. I plan to continue my write-ups on specific positions after the NFL Draft; until then, check out my pieces on which of this year’s receivers and running backs are overrated, and which might be sneaky value picks.