

 - syracuse.com")
My last post introduced the Mitchell Line, a new measuring stick for running back prospects. In short, I defined RB success as a player eclipsing 250 PPR points scored over the first three years of his career. It’s named after Elijah Mitchell, the lowest-scoring player who crossed the line, who’s a solid reference point for RB success.
All in all, I’m satisfied with how it turned out; almost every player above the line was a veritable starter, while the guys below it were fringe players at best. RB data, however, often tells a far cleaner story than receiver data does, since so much of it boils down to college production, receiving ability and opportunity. Receiver statistics, by contrast, often lie, with scheme, usage and QB talent obfuscating the real story.
WR Value and the Shakir Line
While RB’s have the Mitchell Line, receivers have the Shakir Line. For WR’s to clear it, they must produce at least 300 total PPR points over their first three years in the league. The name comes, of course, from Bills WR Khalil Shakir, who just clears the bar. It’s an effective cutoff, in my opinion: with much due respect to Tajae Sharpe and DaeSean Hamilton, we want better producers on our team.
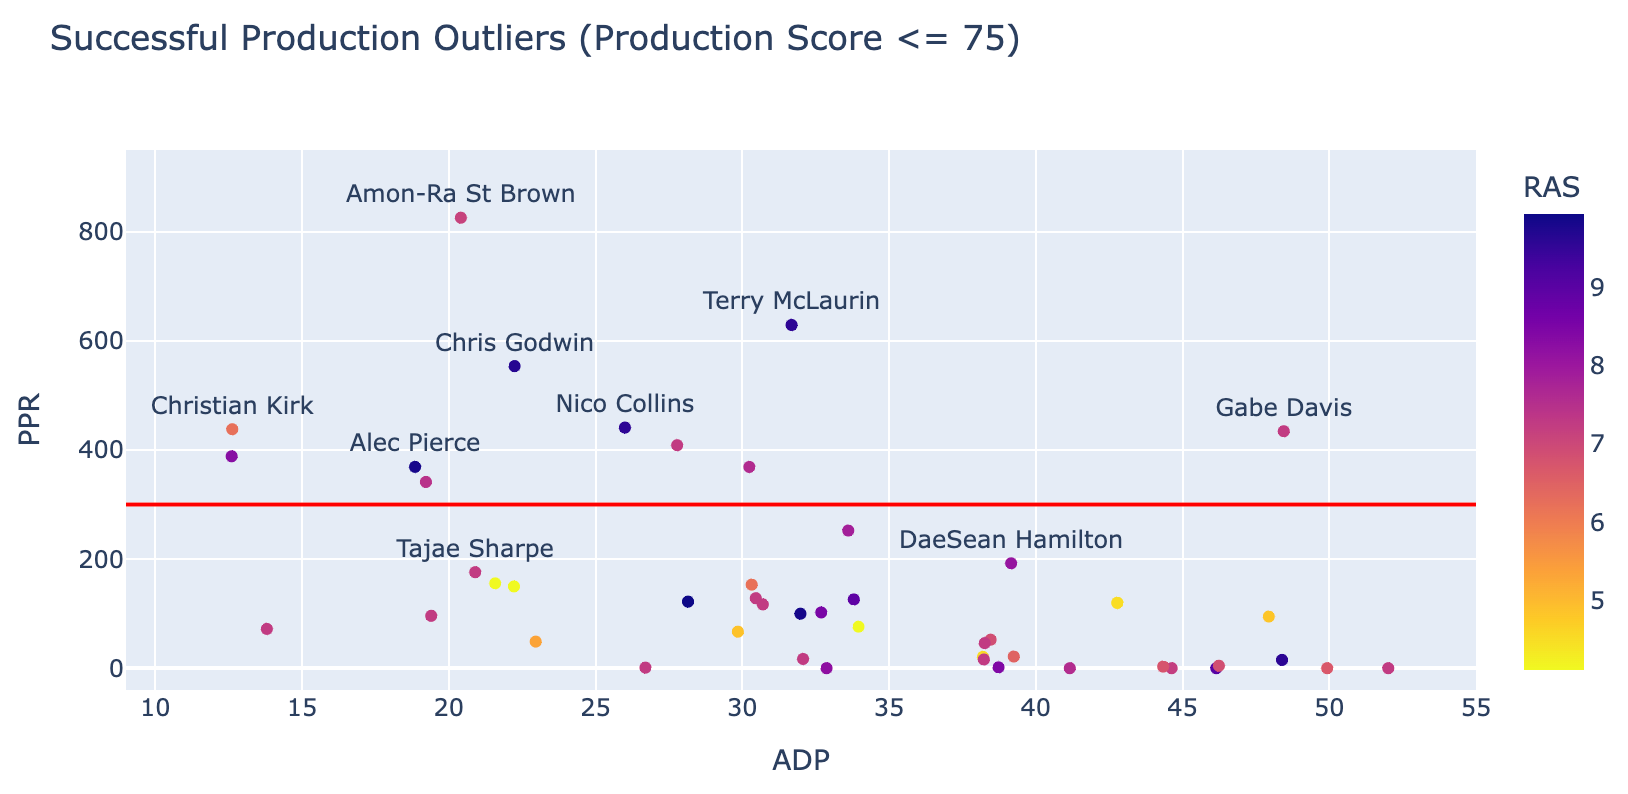
How can we figure out which prospects can clear this bar, then? One useful example is above, where we look at players with a Next Gen Stats Production Score below 75. I’ve already written about Next Gen Stats (NGS) indicators at length; in short, the chart above shows players with iffy college production, who are long shots to succeed.
The success stories in the chart show that athletic outliers can overcome poor college production, with many above-line players boasting very high Relative Athletic Score (RAS) values. Many who clear Shakir Line with more modest RAS numbers—like Amon-Ra St. Brown and Gabe Davis—are still notable athletes, too. Gabe Davis is quite fast for his size, and Amon-Ra St. Brown’s the son of a world-class bodybuilder, which speaks to his physical prowess in a way that RAS might miss.
The best indicators of WR Success
Many of the stats above are credited to Peter Howdy, AKA “Pahowdy”, whose spreadsheet gave me much of this data. The credit for many of these stats is jointly owed to Mr. Howdy and PFF, with Howdy adjusting PFF stats for teammate and target-difficulty considerations. This is the case for two of the metrics we’re using, Caught % (aDOT-Adjusted) and Targeted QB Rating (Teammate-Adjusted).
Our Caught% metric is fairly self explanatory, adjusting a receiver’s catch rate by their average depth-of-target (aDOT). This penalizes guys being fed lay-ups, while rewarding dudes laying out for 50/50 balls. We use Targeted QBR, by comparison, to see how guys “make their QB right” when the ball’s thrown their way. Howdy employs similar adjustments for teammate quality, in an attempt to suss out how much of a player’s Targeted QBR is his own skill, and how much is just his QB balling out.
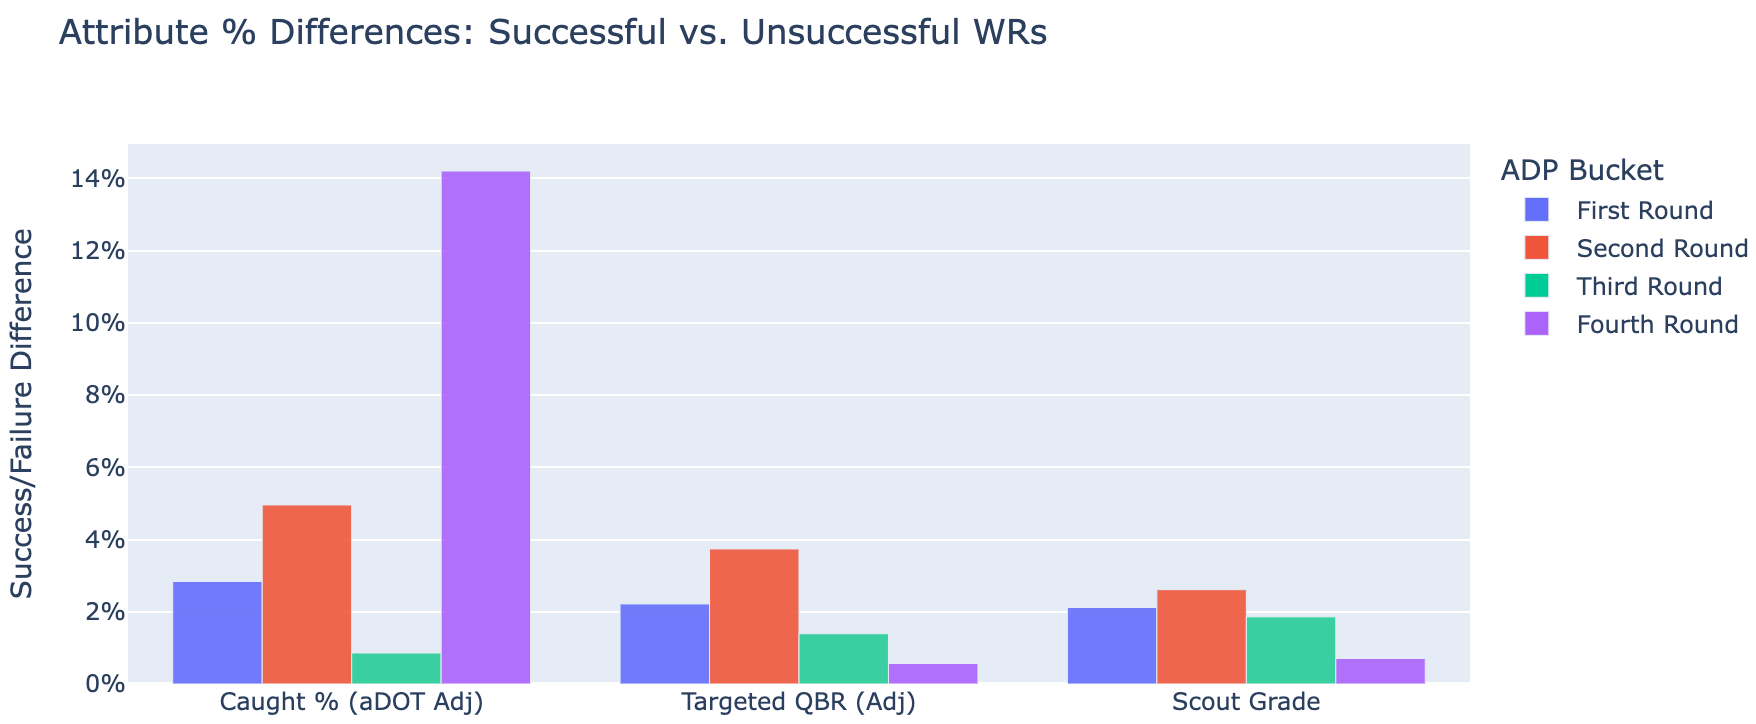
The goal here was to find indicators where, on average, players above the Shakir line scored higher than those below it. I wanted this to hold for all four rounds, too, even given small-sample-size considerations. If a metric is meaningfully worse at predicting third-rounders, for example, then it loses a good deal of utility.
Useful metrics for late-rounders

One notable issue with our previous metrics is their usefulness wavers a bit in the later rounds. Granted, the number of fourth-round success stories is very small, so the volatility in the chart above should be taken with a grain of salt.
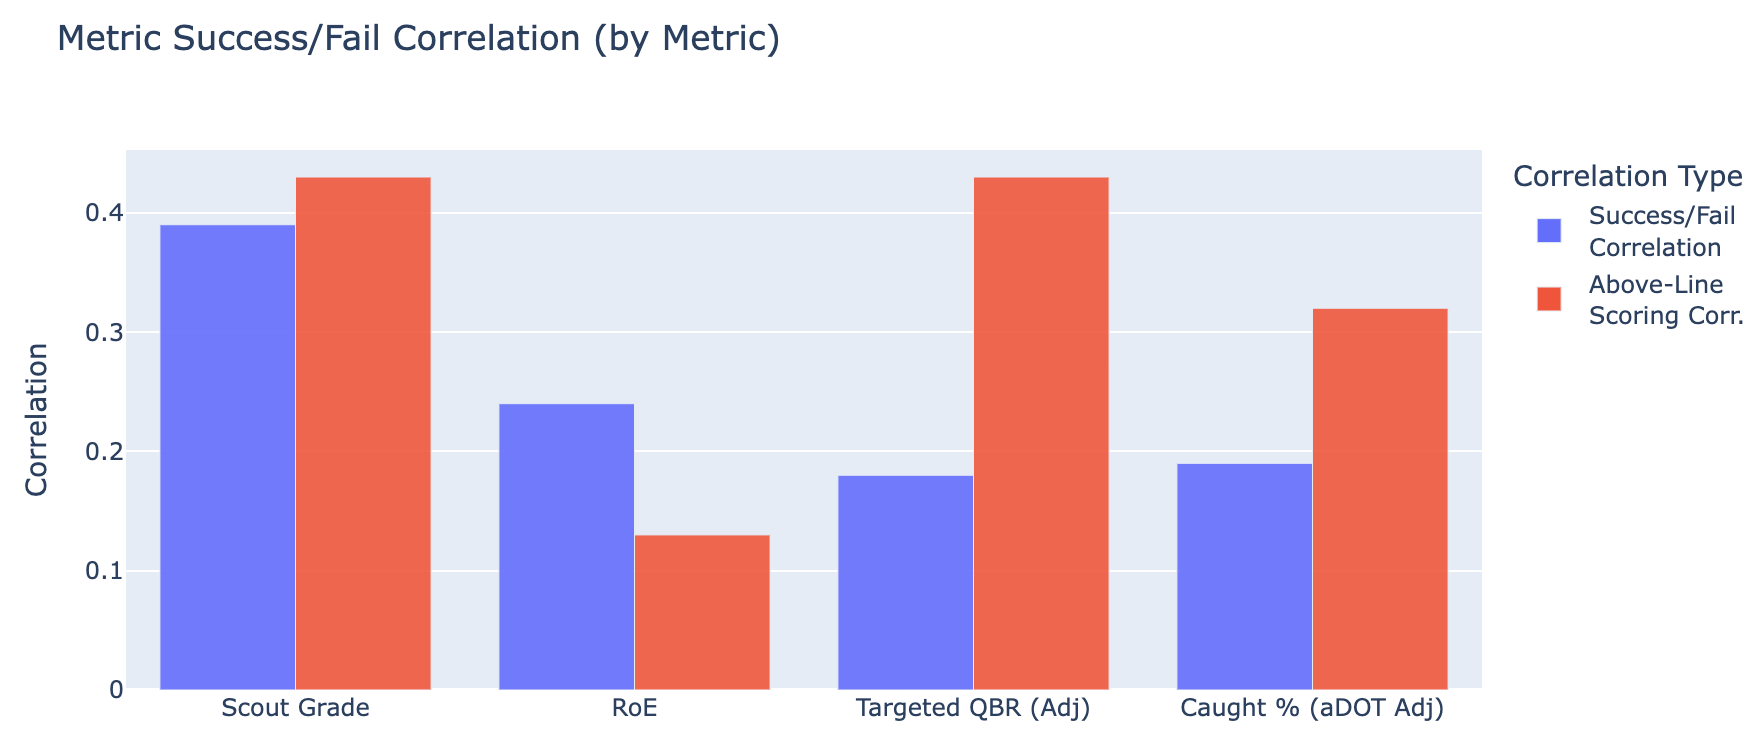
At the same time, though, the two metrics above might be our most informative ones. RoE is an undefined acronym from the Pahowdy spreadsheet, and compares a player’s Receiving Yards per Team Attempt to players with similar slot rates and aDOT numbers. In short, it tells us how much better a player performed to players with comparable usage; thus, I think it makes sense to call it Receiving over Expected.
As for Rushing Yards, it is what it says on the tin, standing in for a variety of extremely similar rushing metrics. We aren’t going to be using it in our analysis—the early/late-round split makes things messy—but it’s still informative. The takeaway is, if an early-round prospect has rushing ability, it bodes well, speaking to their athletic prowess. If a late-round player runs a lot in college, however, it’s an ill omen, implying that it’s their whole shtick, and not just an auxiliary part of their game.
Beyond success: Looking for stars
One thing to note when looking at our WR data is that our metrics are quite adept at separating elite prospects from those who are merely good. They’re meaningfully better at this, in fact, than they are at determining which players will surpass the Shakir Line, in essence putting the cart before the horse.
Thus, while our metrics perform well across all talent levels, they mostly excel at sniffing out star potential among top prospects. To sort out the starters from the scrubs, we use nfl.com’s Scout Grades, which are doled out by analyst Lance Zierlein. Their utility in finding starters may be because elite prospects really stand out: Travis Hunter, for example, earns a grade of 6.89, when most receivers sit in the 6.1-6.3 range.
The difficulty then becomes sorting out which stats truly offer something unique, and which are double-counting. Targeted QBR is a good example of this; its correlation with Zierlein’s grades is .52, far higher than our other metrics. The intuition is simple: top talents go to top schools with good quarterbacks, and thus by using QB Rating, we’re introducing a whole host of additional factors into the mix.
This doesn’t make it a bad metric, though; it’s still different enough from our scouting grades that it’s still worth including. Instead, we’re going to look at two slices of our data, one that utilizes Targeted QBR, and another using our aDOT-Adjusted Caught %. This will hopefully give us a more holistic view of the 2025 receiver class.
The 2025 class, by QBR
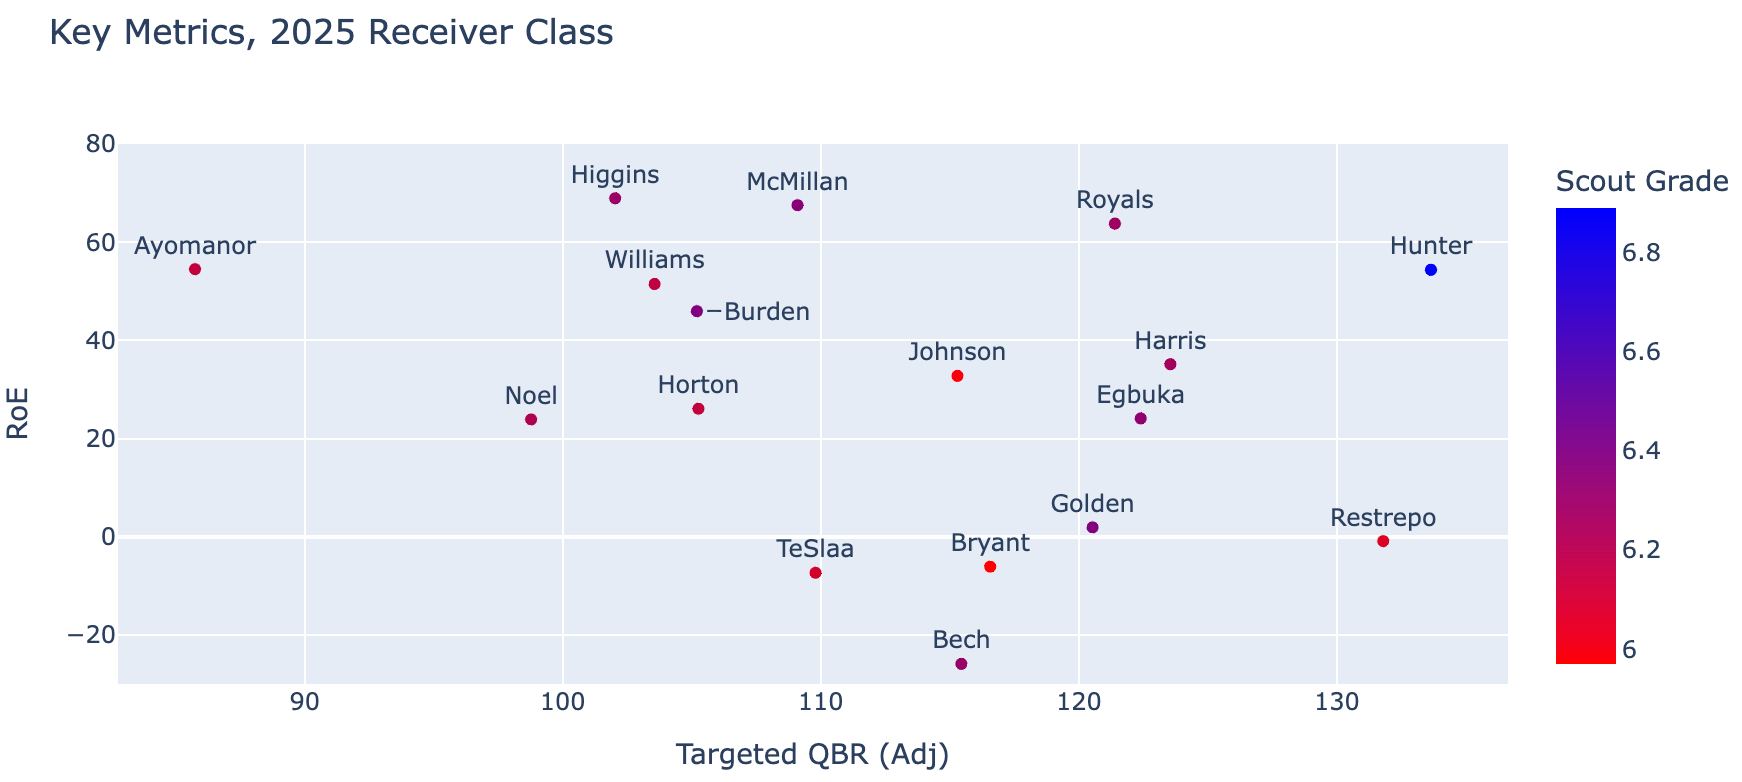
Here we see the 2025 receivers currently considered “draftable” per current expected dynasty ADP. The issues with Targeted QB Rating return here, in that players can only do so much to mitigate QB quality. Travis Hunter would likely still be excellent if Shedeur Sanders weren’t tossing him the pigskin, for example, while Tetairoa McMillan may have been disproportionately hurt by poor QB play.
So how do we solve these issues? Let’s return to RoE, which adjust a player’s receiving production relative to players with similar depth-of-target and slot-rate profiles. For example, Xavier Restrepo looks elite by Targeted QBR, but his slot rate of 65% and aDOT of 6.5 yards tell a different story. In short, he was just catching layups from Cam Ward, and his poor RoE suggests he actually performed worse than you’d expect.
There’s also a trio of mid-round favorites in Jaylin Noel, Jayden Higgins and Kyle Williams that’s worth discussing. The three have some of the worst Targeted QBR numbers on the graph above, but the Iowa St. duo of Noel & Higgins feel disproportionately harmed by QB Rocco Becht’s sub-60% completion percentage.
Williams can put less blame on signal-caller John Mateer, however, who has a real chance to go pro as well. To be sure, all of our other stats back up the Williams hype train, but if there’s any reason to temper expectations, it’s his Targeted QBR.
The 2025 class, by Caught %

We now turn to aDOT-Adjusted Caught % for a different perspective. Tre Harris immediately stands out for his insane catching ability, though there’s a chance his numbers are goosed up by Lane Kiffin’s scheme. The Ole Miss offense helps its receivers get wide open, while also requiring they run a limited route tree.
Harris did have the most contested targets in our sample, however, which lends credibility to his catch rate. Instead, be wary of Jalen Royals, who saw just a third of Harris’ contested targets. I’m still high on Royals at his current price, but he may have benefitted more from scheme than Harris, while also facing worse competition.
At the opposite end, we have Elic Ayomanor, who saw incredibly shaky QB play at Stanford. RoE implies his relative production was good, given the type of routes he was asked to run, but his Caught% is still quite poor, even if we account for target depth.
Matthew Golden and Emeka Egbuka are two other interesting cases: both look great through the lens of Targeted QBR, yet seem worse by depth-adjusted catch rate. The differentiating factor here is RoE, which marks Egbuka as an above-rate slot player, while putting Golden’s outside receiver bona fides into question. Essentially, if Golden’s sub-4.3 speed is a mirage, then it’s hard to make the analytical case for him.
Athleticism & Production Thresholds
Finally, we examine which players clear the Next Gen Stats (NGS) Score bar. The overall score is broken out into two components: Athleticism and Production. While a low score in either is less prohibitive for receivers than it is for RB’s, a rough threshold of 66 still functions as an inflection point where scores become problematic.
This leaves us with three flagged players: Isaac TeSlaa, Tez Johnson and Xavier Restrepo. To say Johnson and Restrepo don’t clear the athletic bar is greatly underselling it, given both would be extreme outliers if they made it in the league. While Johnson’s a solid performer in all our important metrics, there just isn’t much precedent for such an undersized player in the NFL.

Ironically, the case for Restrepo feels much easier: while Johnson is buried under a stacked Tampa Bay depth chart, there’s real reason to believe Restrepo could break camp as a safety valve for former teammate Cam Ward. The margin for error, in short, feels smaller for Johnson, if only because it’s hard to imagine him offering any additional utility beyond just catching the ball.
The opposite is true of TeSlaa, whose athleticism and draft-pick pedigree almost guarantees he’ll see the field in some capacity. Notably, our other metrics don’t rate him as the absolute disaster his NGS Production Score implies, but the sample size is so small it requires an immense degree of projection.
Summary
In short, we want receivers who:
Make their QB’s right (Targeted QBR)
Catch the damn ball (Catch%)
Outperform similar players (RoE)
Pass the eye test (Scout Grade)
Ultimately, predicting receiver success is far harder than it is for RB’s. When we get it right, however, it’s easier to get it really right. If we can guess if a player’s starting-caliber, then we’re well-equipped to figure out if they’re going to be a star, too.
A second difficulty is that it’s hard to separate receiver play from their QB. Granted, offensive lines have a disproportionate impact on RB play, too, yet backs are still consistently put in situations where they get to prove it one-on-one versus defenders. Receivers, by comparison, can only do so much to overcome bad QB play, with even the best players unable to reel in every scattershot pass lobbed their way.
The best we can do, then, is start with catchall metrics, like our Scout Grade, then work from there. Though calling out scout evaluations in particular seems odd, these grades are slightly better than similar comprehensive metrics—such as NGS Score, or where a player was picked in the draft—at determining whether a player is starting caliber. We can gas up Tez Johnson all we want, for example, but given his subpar Scout Grade of a flat 6, it’s more likely than not he won’t make it in the league.
This concludes our deep dive into the 2025 receiver class. I’ll be back soon revisiting Liquidity Index, another idea pulled from a previous post. In the meantime, feel free to subscribe for more content, and follow me on Bluesky (capn-collins.bsky.social) and Twitter (capn_cc) if you’re so inclined.