
Another RB Model
Or: Jeanty is the Truth

In my previous post, I outlined my process for creating a machine learning model for wide receivers. I’m going to spend less time in this post outlining my methodology, if only because I covered it so exhaustively in the prior article.
Today, I’m unveiling a new model that predicts running back performance. We’re still predicting PPR points scored over the first three years of a player’s career, so the outcomes will look fairly similar to those from my last writeup.1
Model Performance
Above are the R² scores for my model on my “test” data, i.e., out-of-sample data it wasn’t trained on. This, in short, means the model has not seen any of the data from 2021 onward, and is predicting blind off what it’s learned so far.2
With that in mind, the results above are quite good. Even if we filter out undrafted players, we get a correlation of .78 between our predictions and actual production, with an R² of .54, for 2021 and 2022 combined. Per one Redditor’s analysis, this is meaningfully better than most other models’ past performance.
This warrants multiple qualifications, of course. The models cited in the analysis were judged both on different criteria and time frames (the Redditor’s comment is from at least four years ago). It’s entirely likely, too, that 2021 through 2023 were relatively easy classes to predict; by comparison, 2024 looks much more difficult. Since many of its members have yet to see the field, however, I’m not including it in my analysis.
It’s also worth noting that running backs might just be easier to predict than other positions. Per Next Gen Stats3 , their model-generated “Production Score” is more indicative of running back success than any individual feature. Conversely, that same score is only fourth in importance for receivers, and 12th for tight ends. This means that, relatively speaking, analytical models are good at predicting RB success, while they lag behind individual metrics (like 40 time or overall athleticism) for WR’s and TE’s.
Feature importance
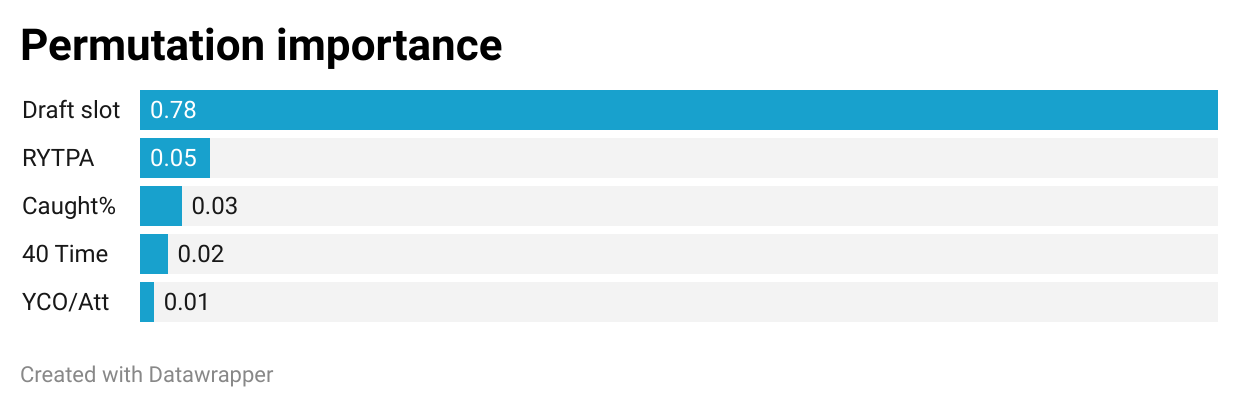
Above are the feature importances for our model. Obviously, a player’s draft slot is the most important feature, yet it isn’t the only useful one. To get a model as robust as ours, it really does require most of our other features: every bit of performance counts.
This might benefit from the minimal overlap between our top features.4 Most redundant are combine results, which tracks: a player who tests well in the shuttle drill will likely turn in a good three-cone result, too. This is why a player’s 40 time ranks so highly, if only because it’s the one drill RB’s rarely skip.
What this means is that many metrics which seem extremely similar—like Receiving Yards per Team Pass Attempt (RYTPA)5 and PFF’s Caught%—actually offer unique info. While there still is some overlap (around a .22 correlation), they’re each telling us different stories. RYTPA tells us if a back was a big part of his team’s passing game, while Caught% indicates whether he can actually catch the ball.
The 2025 Class
Above are the model’s three-year predictions (in total PPR points scored) for the 2025 RB class. The upside and risk categories are derived from various cutoffs in the ceiling and floor columns, respectively. (Note: click on the right arrow above the table to see the rest of the class.)
Much like Travis Hunter broke clear from the pack in our receiver group, Ashton Jeanty is leaps and bounds above our other running backs. I will note, however, that the margin between him and Hampton might be smaller than it seems. Some other versions of my model ranked Omarion Hampton above Jeanty, which speaks to the UNC product’s potential.
Yet in its current state, the model reckons Hampton’s ceiling is actually worse than that of TreVeyon Henderson, who is second only to Jeanty in terms of upside. Henderson, however, is flagged as a medium-risk prospect, while Hampton is decidedly low-risk. Perhaps this is due to the volatile nature of explosive backs like Henderson, since the model isn’t explicitly accounting for his extensive injury history.

At first, I thought Henderson being a second-rounder was why the model saw him as comparatively risky. Yet multiple backs taken later are seen as higher-floor picks by the model, including Quinshon Judkins and Cam Skattebo.
Skattebo in particular is a good example of the model’s robustness, and how it relies on a lot more than just draft capital. His bullish projection is likely driven by his exceptionally high RYTPA, which is twice—if not four times—the number seen by most other RB’s.
There are a lot of nits to pick, of course, about whether his excessive usage is actually a good thing, due to the wear-and-tear that comes with it. It’s even more valid when discussing Devin Neal, for example, who saw his quickness take a downturn in 2024. The model likes Neal enough to justify his relatively high ADP, but its low floor projection is a stark reality check for fans of the sixth-rounder.
Finally, we can see that RJ Harvey and Bhayshul Tuten share extremely similar outcome profiles. The difference, of course, is that the model sees Tuten as a high-risk player, while Harvey is merely rated as medium-risk.
In any case, it sees Harvey as much closer to the second tier of backs than the first, his saving grace being taken far earlier than his peers in the NFL Draft. Perhaps this is my own personal bias seeping in—I’ve drafted Tuten in two leagues, after all—but I think acquiring Tuten in the mid-to-late second is a far better deal than Harvey in the late first.
Player Comparisons
Above are our upside and downside comps for the 2025 running back class. These are, once again, selected from the best- and worst-producing backs among a player’s most similar comps.6
Many of these comps are really great, with minimal thumbing of the scale on my part. It’s hard to think of a better upside comp than Nick Chubb for new Browns RB Quinshon Judkins, for example. Equally rich is Bhayshul Tuten getting a Devon Achane comp; both ran a 4.32 forty-yard dash, while also being undersized prospects.
Not all our comps are this perfect, of course, but they’re still interesting for the top two guys in this class. Jeanty has an upside comp of Christian McCaffrey, while his downside is fellow Raider great Darren McFadden, which basically means he’s too good to fail.
Hampton’s upside case is a bit curious, given how the blazing-fast Chris Johnson probably matches him more from a production standpoint than a speed angle. Rashaad Penny, however, is more interesting, especially given Hampton also ran a 4.46 forty-yard dash. With Penny being a talented late-first-rounder whose career was derailed by injuries, I think that’s a pretty fair floor case for Hampton.
Final Thoughts
So what are the takeaways, then, for people who can’t just run my model on their own? What should we expect not just from this class, but further running back classes down the line?
Well, the unsexy answer is to take backs who were picked early in the NFL draft. Even if that seems blindingly obvious, it still tells us something when the model ranks a late-round back like Devin Neal ahead of mid-rounders. Since draft pedigree matters so much, a sixth-rounder has to be a strong producer to outshine earlier picks.
Yet late-round picks like Neal also have a nonzero chance of being cut, which is one of our model’s shortcomings. Other issues abound, too, such as our model overvaluing a player based on his peak year. This is the case for Ollie Gordon, who, in 2024, couldn’t quite reach the stratospheric heights of his 2023 season.
With all these caveats, what’s left for us to fall back on? If I had to sum up our model’s findings, you want a back with these qualities:
Was picked (reasonably) early in the NFL draft
Ran a fast 40
Is a good receiver
At the very least, you want a back who clears the bar in two of the three areas, like Bhayshul Tuten, who ran a good 40 and can also catch the ball. Barring that, you need a guy who’s superlative in one area, like Cam Skattebo, who, as an RB, commanded a truly ridiculous share of his team’s pass game targets.
That’s all for this post; once again, you can follow me at capn-collins on Bluesky, and at capn_cc on Twitter. Thanks again for reading; hit me up in the comments with any lingering questions (and, of course, subscribe for free updates)!
For those interested, the training and validation sets were still the same (2008-16 for training, 2017-20 for validation). The biggest change was switching from a Laplace to Normal distribution for my NGBoost model; the Normal setup also performed slightly better for receivers, too. I ended up choosing Laplace to improve my results for the 2023 receiver class, though I might backtrack when I do next year’s predictions.
The caveat, of course, is that I still use this test data to judge which model is best, even if the model itself is flying blind. The 2025 class will thus be a “purer” judge of my model’s abilities.
An analytics partnership between Amazon and the NFL, which I’ve written about extensively.
Despite this, NGBoost feature importance is still relatively difficult to extract from the model. I ended up using permutation importance, which “scrambles” each feature’s values, then see how this impacts the model’s performance. This leads us to draft slot being so important: you can mess with other features and see only a slight performance decrease, but if you garble our draft slot values, the model really struggles.
A Pahowdy calculation; most of my data for this project is sourced from his spreadsheet. The rest comes from Stathead.
For backs who haven’t played three full years yet, we basically project their current PPR rate out a year or two. Also note that the downside comps can be somewhat arbitrary, since there are a lot of dudes in our dataset who scored zero points.